
Introduction
Analysing the sensor measurement data of the sensors on your Assets can give you valuable information on your Assets' maintenance status and lets you plan maintenance events well ahead of time.
In order to access the sensor measurement data of your Assets, follow the steps below.
Video tutorial: Analyzing measurement data
00:00: Analyzing the sensor measurement data of your Assets can give you valuable information on your Assets' maintenance status and lets you plan maintenance events well ahead of time.
00:09: In order to access the sensor measurement data of your Assets, follow the steps in this tutorial.
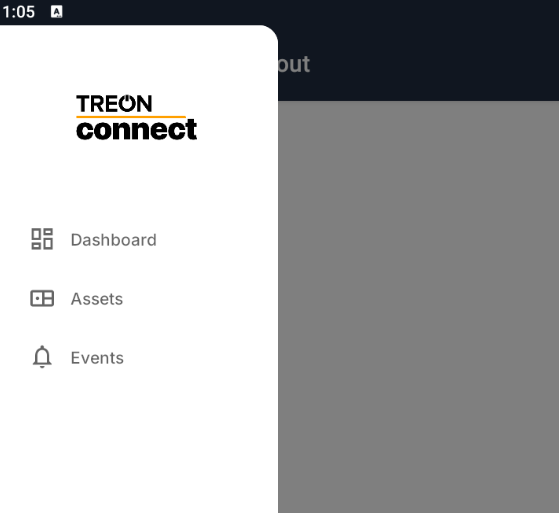
00:16: Launch the tree on Connect Mobile app on your smart device.
00:20: Click the menu icon in the top left corner of your screen.
00:24: In the navigation plane on the left side, click the Assets menu.
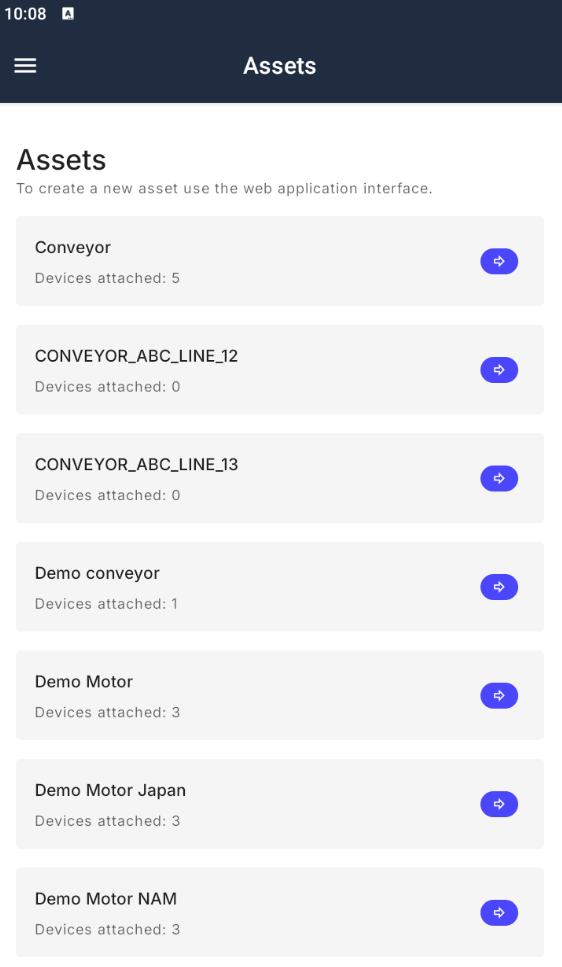
00:29: You can now view the list of Assets assigned to you.
00:33: From the list, choose the Asset you would like to see measurement data from.
00:37: This will open the Asset’s details with all sensors attached to the Asset.
00:44: If only one sensor is attached to the Asset, you will only see this one sensor.
00:51: On the bottom menu, choose Trends to access the Trends menu to view your sensor measurement data.
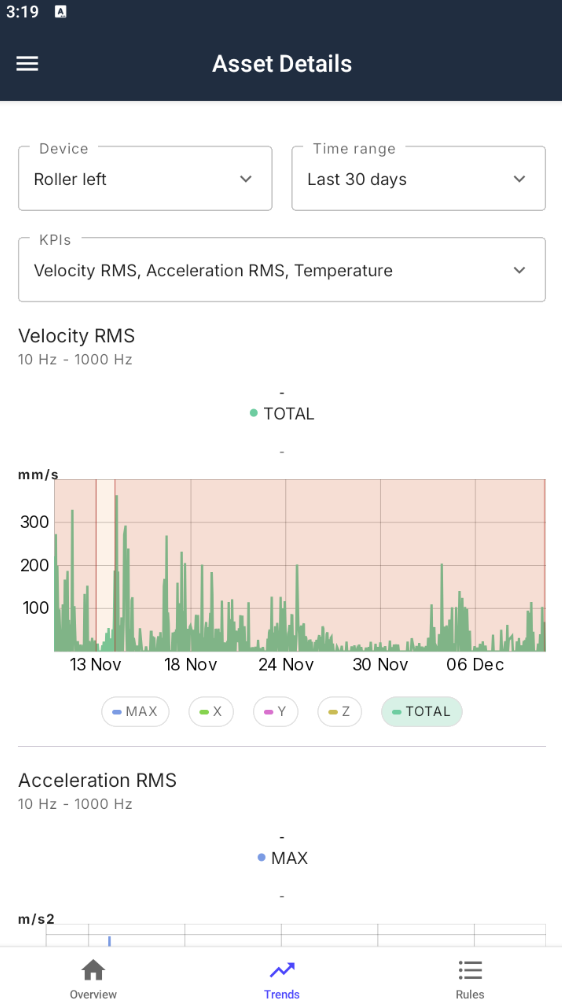
00:58: You will now see a page with the measurement details of this Asset.
01:02: You can choose which sensor’s data to view, the KPI and the time range: Click the Device drop-down menu.
01:09: Choose the sensor device on the Asset that you would like to view measurement data from.
01:16: If only one sensor is attached to the Asset, you can only choose this one device. If multiple devices are attached to the Asset, please choose one from the drop-down list.
01:27: You can choose the time range of the measurement data by clicking the "Time range drop-down menu.
01:32: Choose the time range for which to see data from. You can choose any time range from the last 3 hours to the last 30 days from the drop-down menu.
01:42: You can also define a custom time range by choosing the option "Custom".
01:47: Click the control button labeled "_ctl.W" to proceed with the ongoing task.
01:54: Choose the type of measurement data you would like to view in the drop-down menu. You can select multiple Key Performance Indicators at the same time.
02:03: The data has been successfully updated to your selected settings.
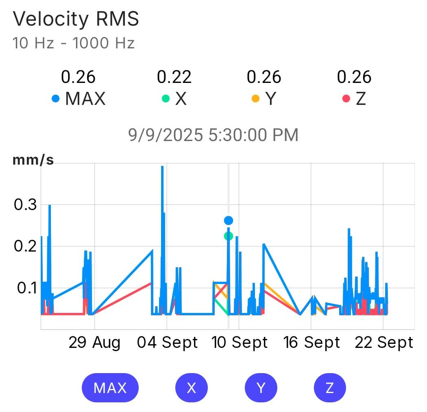
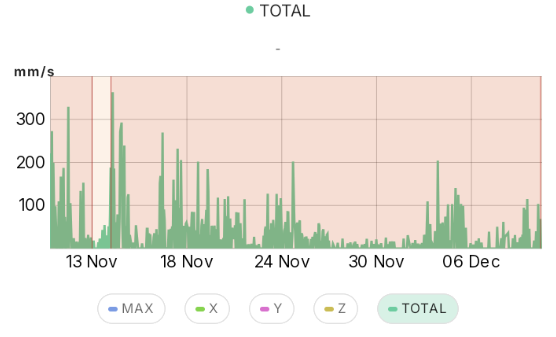
02:09: At the top under "Total" you will find an overview of the measurement data.
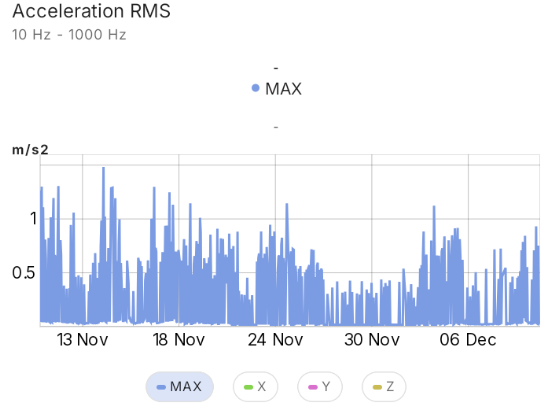
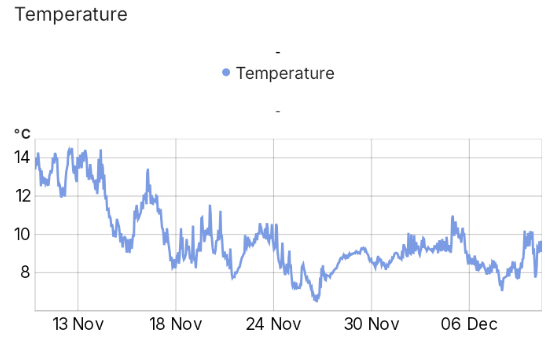
02:14: Swipe down to see all KPIs you have selected from the menu
02:18: The graphs are fully interactive. You can select any data point by clicking on the graph, and the value for this measurement will show above the graph.
02:28: In this example, we have chosen a data point for 25th November 2025 at 1:30 pm.
02:35: The value in this data point is displayed on top of the graph. In the example, the Velocity RMS for this time is 48.19
02:45: You can explore and analyze the measurement data on your own now.
02:51: You can change the display parameters at any point by switching the Device, the ime range and the KPIs from the pull-down menus at the top.
03:00: You have successfully completed the video tutorial on reading your Asset's measurement data in the Treon Connect Mobile app.
Step-by-step tutorial: Analyzing measurement data
Step 1: Open Assets in Treon Connect Mobile
Open the Treon Connect app on your phone.
In the navigation plane on the left side, click the Assets menu.
Step 2: Choose Asset
From the list of Assets, choose the Asset you would like to see data from.
This will open the Asset’s details with all sensors attached to the Asset.
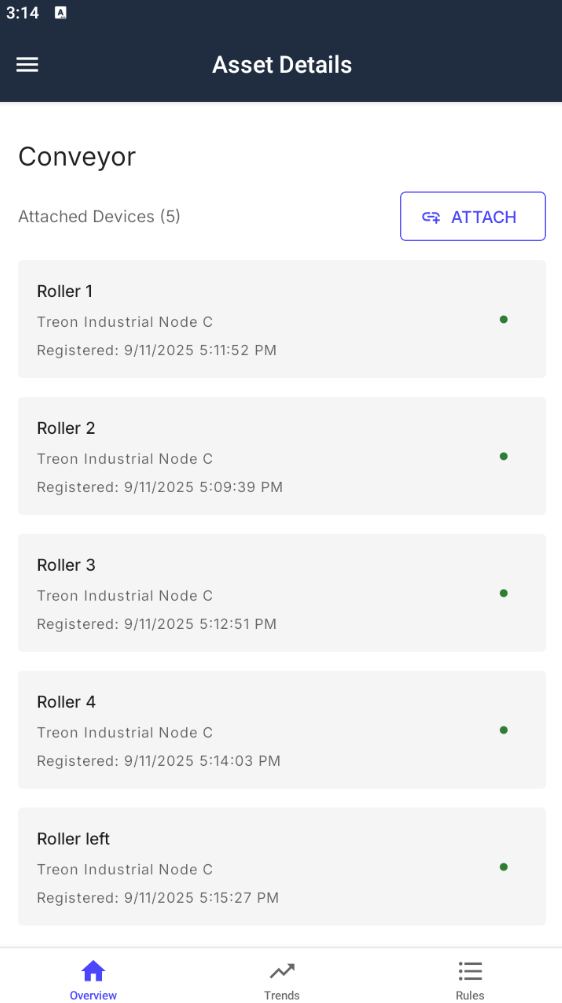
On the bottom menu, choose Trends to access the Trends menu to view your sensor measurement data.
Step 4: Choose measurement data
You can choose which sensor’s data to view, the KPI and the time range:
- Device: Choose the sensor device on the Asset that you would like to view measurement data from. If only one device is attached to the Asset, you can only choose this one device. If multiple devices are attached to the Asset, please choose the correct one from the drop-down list.
- Time range: Choose the time range for which to see data from. You can choose any time range from the last 3 hours to the last 30 days from the drop-down menu.
- KPIs: Choose the type of measurement data you would like to view in the drop-down menu. You can select multiple KPIs (Key Performance Indicators) at the same time.
You will see the overview of your KPIs in Total and below the measurment data for the KPIs you selected.
Please Note: When you select multiple KPIs, the data for these KPIs will be shown one after the other. Please scroll down the screen to see all data.
If you would like to change the parameters of your data, you can switch the sensor, the KPIs and the time range at any time.
The graphs are fully interactive. You can select any data point by clicking on the graph, and the value for this measurement will show above the graph:
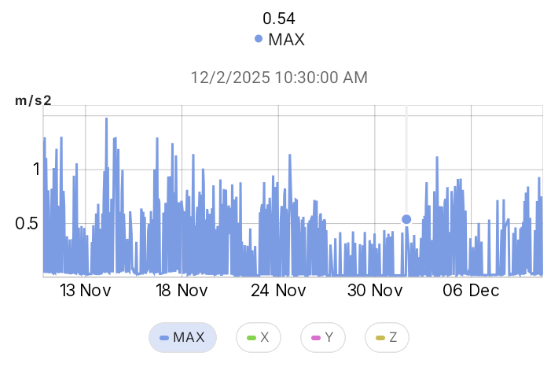
In this example, the measurement value for the KPI Acceleration RMS was 0.54 on 12th February 2025 at 10:30 am.