Caution! Article for developers
Information on this page is intended particularly for users with advanced technical knowledge.Node Telemetry
Introduction
From Treon Aito Release 7.1 for Gateway onward, it is possible to enable sending telemetry data from the nodes in the mesh network to the MQTT broker. This can be very helpful in monitoring the deployment quality and performance of the mesh network.
Additionally in versions 7.2 and higher, you can also access this feature from Configuration UI under the name “Mesh Diagnostics”. You can use it to see the connection strength between devices.
For example, issues such as low connection quality between individual nodes, long routing chains that may lead to increased power consumption, or message buffers maxing out on select nodes can easily be identified.
Please note: The feature already exists in Treon Aito Release 7.0 for Gateway, but needs to be activated manually in this release version.
The telemetry data will be sent to your backend with a time interval that is specified JSON format. An example of the data is:
{"DiagInterval":{"sink0":{"Interval":60,"SinkAddr":"11299123"}},"DiagData":{"13088562":{"Timestamp":1678698843805,"HopCount":1,"DeviceType":"unknown","TravelTime":0,"NextHopRSSI":-58,"NextHopAddr":11299123,"SinkAddr":11299123,"Role":130,"AccessCycle":8000,"NextHopCost":2,"SensorNodeId":"f933b7c7"},"11299123":{"Timestamp":1678698895593,"HopCount":1,"DeviceType":"unknown","TravelTime":23,"Role":20,"WirepasVersion":83886592}},"GatewayId":"52824fad","Type":"WirepasDiag","Ver":"1.0.0"}
The fields are defined as following:
| JSON | Description |
|---|---|
| Timestamp | Unix epoch (ms) when the Treon Gateway received the message. |
| HopCount | The number of “hops” the node is away from sink. The Treon Gateway has a HopCount of 0. A node connected directly to the gateway has a HopCount of 1. |
| TravelTime | The time messages take to reach the sink. |
| NextHopRSSI | The RSSI (signal strength) in dBm for the next node closer to sink. |
| NextHopAddr | The Wirepas address of the next node closer to sink. |
| SinkAddr | The Wirepas address of the Treon Gateway the node is connected to. |
| Role | This value is represented in decimal, but Wirepas documentation can show these as hex sometimes. 130 is Routing ON, 3 is non-routing and 20 is for the sink (Treon Gateway). |
| AccessCycle | How many milliseconds the node sleeps in between access cycles. |
| NextHopCost | A calculated value for Wirepas diagnostics that is used by nodes to select the optimal route to the sink. |
| SensorNodeId | The serial number the node uses. In this data set and apart from this value, the nodes are identified by their Wirepas address instead. |
Please also see the full JSON specification (v1.0.0 & v1.0.1) according to JSON Schema.

Activating Node Telemetry with SSH
In Treon Aito Release 7.0 for Gateway, the Node Telemetry feature needs to be activated manually via a small configuration change when connected to the Treon Gateway via SSH.
- Connect via SSH to the Treon Gateway.
- Active the desired Diagnostic Interval with the command:
sudo sed -i "/DiagnosticInterval=/c\DiagnosticInterval=600" /opt/iotgw/conf.d/wirepas_override.conf
Replace 600 with the desired Diagnostic Interval value in seconds. The only accepted values are: 0, 30, 60, 120, 300, 600 and 1800. A value of 0 will deactivate diagnostics completely.
- Create a .conf file in /opt/iotgw/conf.d/:
echo -e "[Startup]\nDataProcessors3 += WpDiag" > /opt/iotgw/conf.d/nodetelemetry.conf
- Apply the changes with:
sudo systemctl restart iotgw
Activating Node Telemetry with DM commands
In Treon Aito Release 7.1.1 for Gateway and higher, the Node Telemetry feature can also be activated via Device Management commands.
- To activate/deactivate Node Telemetry with DM commands, you need to first enable the feature by turning it on or off with the following commands
Turn ON
{"Ver": "2", "Cmd": "set", "T" : [33580,0],"Res":[7],"Val": ["AQ=="],"I":22}
Turn OFF
{"Ver": "2", "Cmd": "set", "T" : [33580,0],"Res":[7],"Val": ["AA=="],"I":22}
- Optional you can change the diagnostic interval with the following command
{"Ver": "2", "Cmd": "set", "T" : [33580,0],"Res":[5],"Val": ["AAA="],"I":22}
Replace 600 with the desired value in seconds. The only accepted values are: 0,30,60,120,300,600 and 1800. A value of 0 will deactivate diagnostics.
| Time(seconds) | base64 encoded |
|---|---|
| 0 | AAA= |
| 30 | HgA= |
| 60 | PAA= |
| 120 | eAA= |
| 300 | LAE= |
| 600 | WAI= |
| 1800 | CAc= |
- You need to reboot the Treon Gateway to apply the changes with the command:
{"Ver": "2", "Cmd": "execute", "T" : [3,0],"Res":[4],"Val": ["AA=="],"I":22}
Using Node Telemetry
The diagnostic data you receive as JSON message will look as follows:
{
    "DiagInterval":
        {
         "sink0":
            {"Interval":300,"SinkAddr":"10000000"
            }
        },
    "DiagData":
        {
         "12345678":
            {"Timestamp":1600602053770,"HopCount":1,"DeviceType":"unknown","TravelTime":20,"NextHopRSSI":-40,"NextHopAddr":12000000,
             "SinkAddr":10000000,"Role":130,"AccessCycle":8000,"NextHopCost":4,"SensorNodeId":"a1a1a1a1"},
              },
    "GatewayId":"aaaaaaaa",
    "Type":"WirepasDiag",
    "Ver":"1.0.0"
}
| Interval | Time interval between node telemetry status messages in milliseconds |
| Timestamp | Time in Epoch Unix Time |
| HopCount | How many hops between the device and the sink |
| DeviceType | Device type is currently shown as ‘unknown’ (device type can be identified via Node Inventory feature) |
| TravelTime | Diagnostic message travel time from device to sink in milliseconds |
| NextHopRSSI | Energy signal strength (RSSI) to the next hep on the route to the sink in dBm |
| NextHpAddr | Wirepas address of the next hop on the route to the sink |
| SinkAddr | Wirepas address of the sink |
| Role | Routing role: 130 = routing node; 3 = non-routing node |
| AccessCycle | Current standard latency time |
| NextHopCost | Wirepas value, basis for mesh network self-organisation (higher value = higher cost) |
| SensorNodeId | Serial number of the Treon product |
| GatewayID | Serial number of the Treon Gateway |
In the process of self-organisation and optimization, the Wirepas mesh network takes multiple factors into account. This means that the NextHopCost value only states the cost factor of sending data to the next Wirepas device, not of sending the data to the sink.
Example
{
    "DiagInterval":
        {
         "sink0":
            {"Interval":300,"SinkAddr":"10000000"
            }
        },
    "DiagData":
        {
         "11111111":
            {"Timestamp":1600602000000,"HopCount":1,"DeviceType":"unknown","TravelTime":20,"NextHopRSSI":-40,"NextHopAddr":10000000,
             "SinkAddr":10000000,"Role":130,"AccessCycle":8000,"NextHopCost":2,"SensorNodeId":"a1a1a1a1"},
              },
{
         "11111112":
            {"Timestamp":1600602000000,"HopCount":2,"DeviceType":"unknown","TravelTime":80,"NextHopRSSI":-40,"NextHopAddr":11111112,
             "SinkAddr":10000000,"Role":130,"AccessCycle":8000,"NextHopCost":2,"SensorNodeId":"a2a2a2a2"},
              },
{
         "11111113":
            {"Timestamp":1600602000000,"HopCount":3,"DeviceType":"unknown","TravelTime":120,"NextHopRSSI":-40,"NextHopAddr":11111112,
             "SinkAddr":10000000,"Role":130,"AccessCycle":8000,"NextHopCost":1,"SensorNodeId":"a3a3a3a3"},
              },
{
         "11111114":
            {"Timestamp":1600602000000,"HopCount":3,"DeviceType":"unknown","TravelTime":140,"NextHopRSSI":-40,"NextHopAddr":11111112,
             "SinkAddr":10000000,"Role":130,"AccessCycle":8000,"NextHopCost":3,"SensorNodeId":"a4a4a4a4"},
              },
{
         "11111115":
            {"Timestamp":1600602000000,"HopCount":4,"DeviceType":"unknown","TravelTime":175,"NextHopRSSI":-40,"NextHopAddr":11111114,
             "SinkAddr":10000000,"Role":130,"AccessCycle":8000,"NextHopCost":4,"SensorNodeId":"a5a5a5a5"},
              },
{
         "11111116":
            {"Timestamp":1600602000000,"HopCount":4,"DeviceType":"unknown","TravelTime":250,"NextHopRSSI":-40,"NextHopAddr":11111114,
             "SinkAddr":10000000,"Role":130,"AccessCycle":8000,"NextHopCost":2,"SensorNodeId":"a6a6a6a6"},
              },
{
         "11111117":
            {"Timestamp":1600602000000,"HopCount":1,"DeviceType":"unknown","TravelTime":10,"NextHopRSSI":-40,"NextHopAddr":10000000,
             "SinkAddr":10000000,"Role":130,"AccessCycle":8000,"NextHopCost":1,"SensorNodeId":"a7a7a7a7"},
              },
{
         "11111118":
            {"Timestamp":1600602000000,"HopCount":1,"DeviceType":"unknown","TravelTime":7,"NextHopRSSI":-50,"NextHopAddr":10000000,
             "SinkAddr":10000000,"Role":3,"AccessCycle":8000,"NextHopCost":1,"SensorNodeId":"a8a8a8a8"},
              },


    "GatewayId":"abcd1234",
    "Type":"WirepasDiag",
    "Ver":"1.0.0"
}
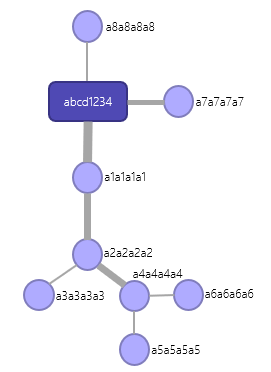
In this example there is 1 Treon Gateway with 8 Treon Industrial Nodes:
1 Treon Industrial Node is connected directly to the Treon Gateway and is non-routing.
1 Treon Industrial Node is connected directly to the Treon Gateway and set to routing, though not routing any data.
1 Treon Industrial Node is connected directly and routing the data from 5 other nodes.
Using the data from NodeTelemetry, you can build the following topology tree in your backend:

