Condition monitoring
See the health of every asset across your sites at a glance. Condition gives you a severity dashboard by group, then trends and spectra for each measurement point and side-by-side comparisons.
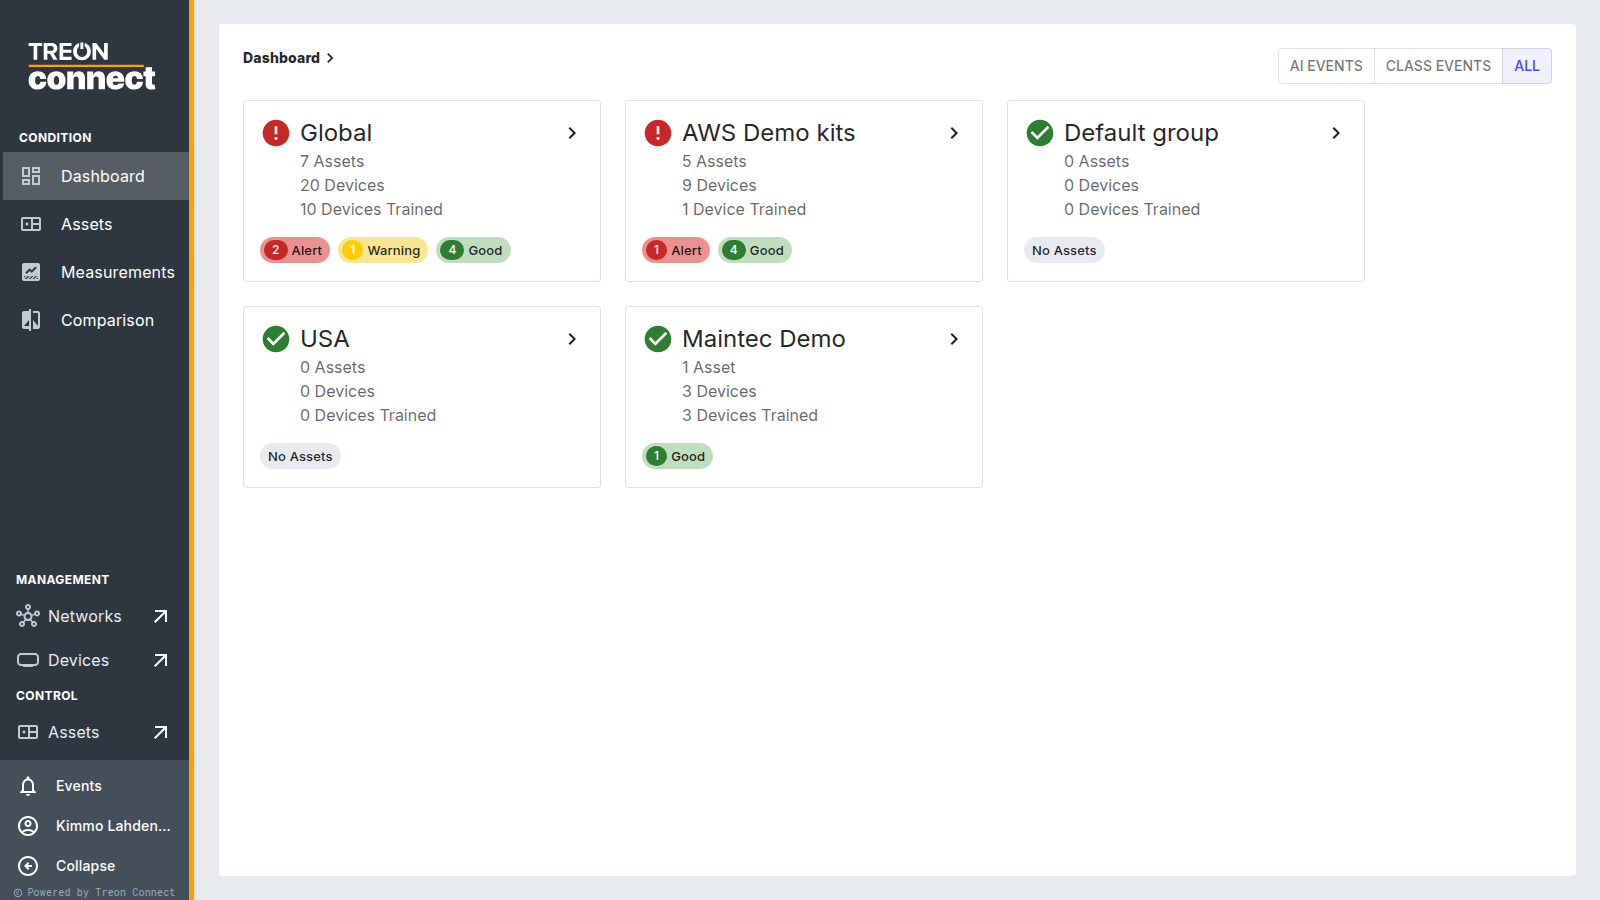
The Dashboard shows a card per group with its asset/device counts, how many devices have a trained AI model, and a Alert / Warning / Good breakdown. The AI Events / Class Events / All toggle switches which kind of events drive those severity counts. Click a group to drill into its assets, then an asset to reach its measurement points.
Sections
- Dashboard — group and asset health at a glance
- Measurements — trends, spectra and waveforms for a measurement point
- Comparison — compare the same KPI across points or time ranges
Group drill-down
Clicking a group card shows the assets in that group and its sub-groups. If a large instance's dashboard is slow to load, narrow the group selection.