Dashboard
Know where to go before you walk to the machine. Each group shows Good, Warning and Alert counts and how many devices have finished AI training. Tap a group to drill down to an asset.
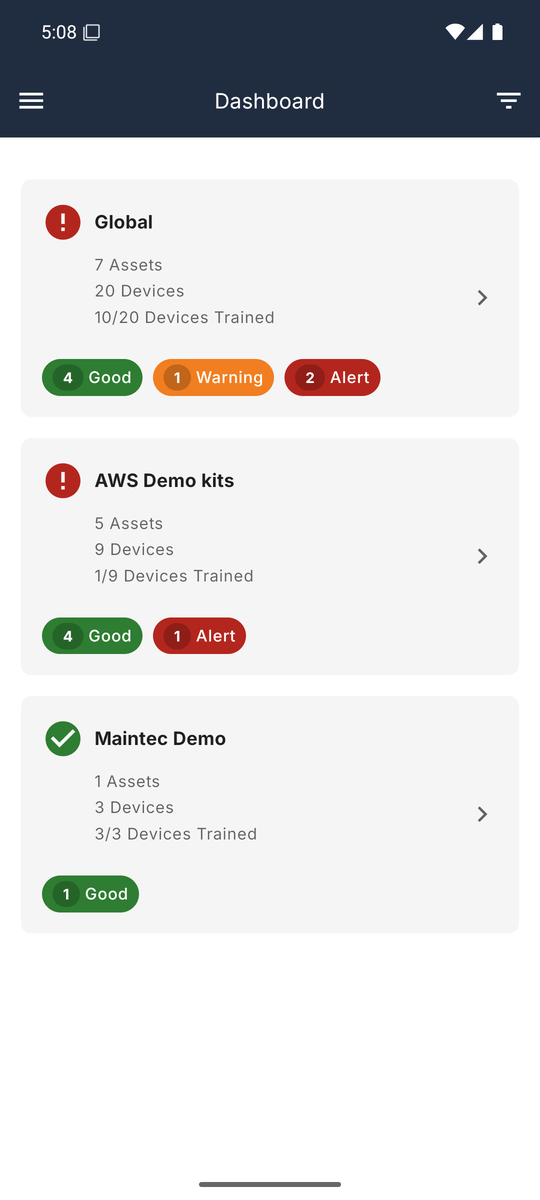
Tapping a card drills down through the group tree to an asset and its devices — the same hierarchy you know from the web, with a breadcrumb to step back up.
KPI trends
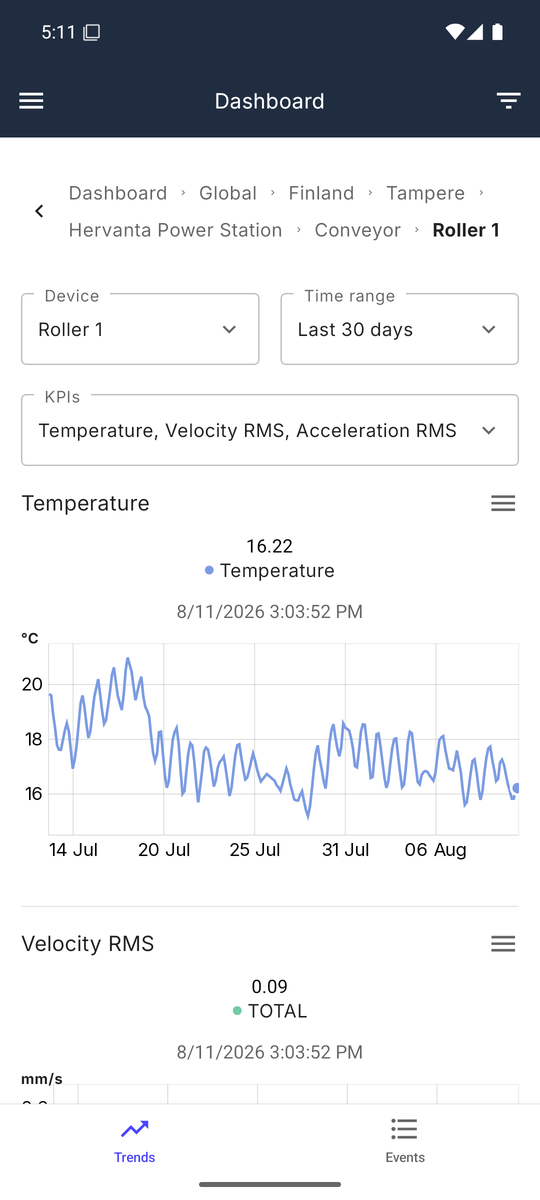
Drilling down to a device gives you its KPI trends — pick a time range and the KPIs to plot (temperature, velocity RMS, acceleration RMS), and check the machine's condition on the spot. The same view lists the device's events on its second tab.