Measurements
Go from a KPI trend to the root cause. Every measurement point shows trends and events. On Treon Industrial Node X (Treon Make), it also shows FFT spectra and waveforms.
Pick a point with the group selector and the asset/measurement-point selector at the top.
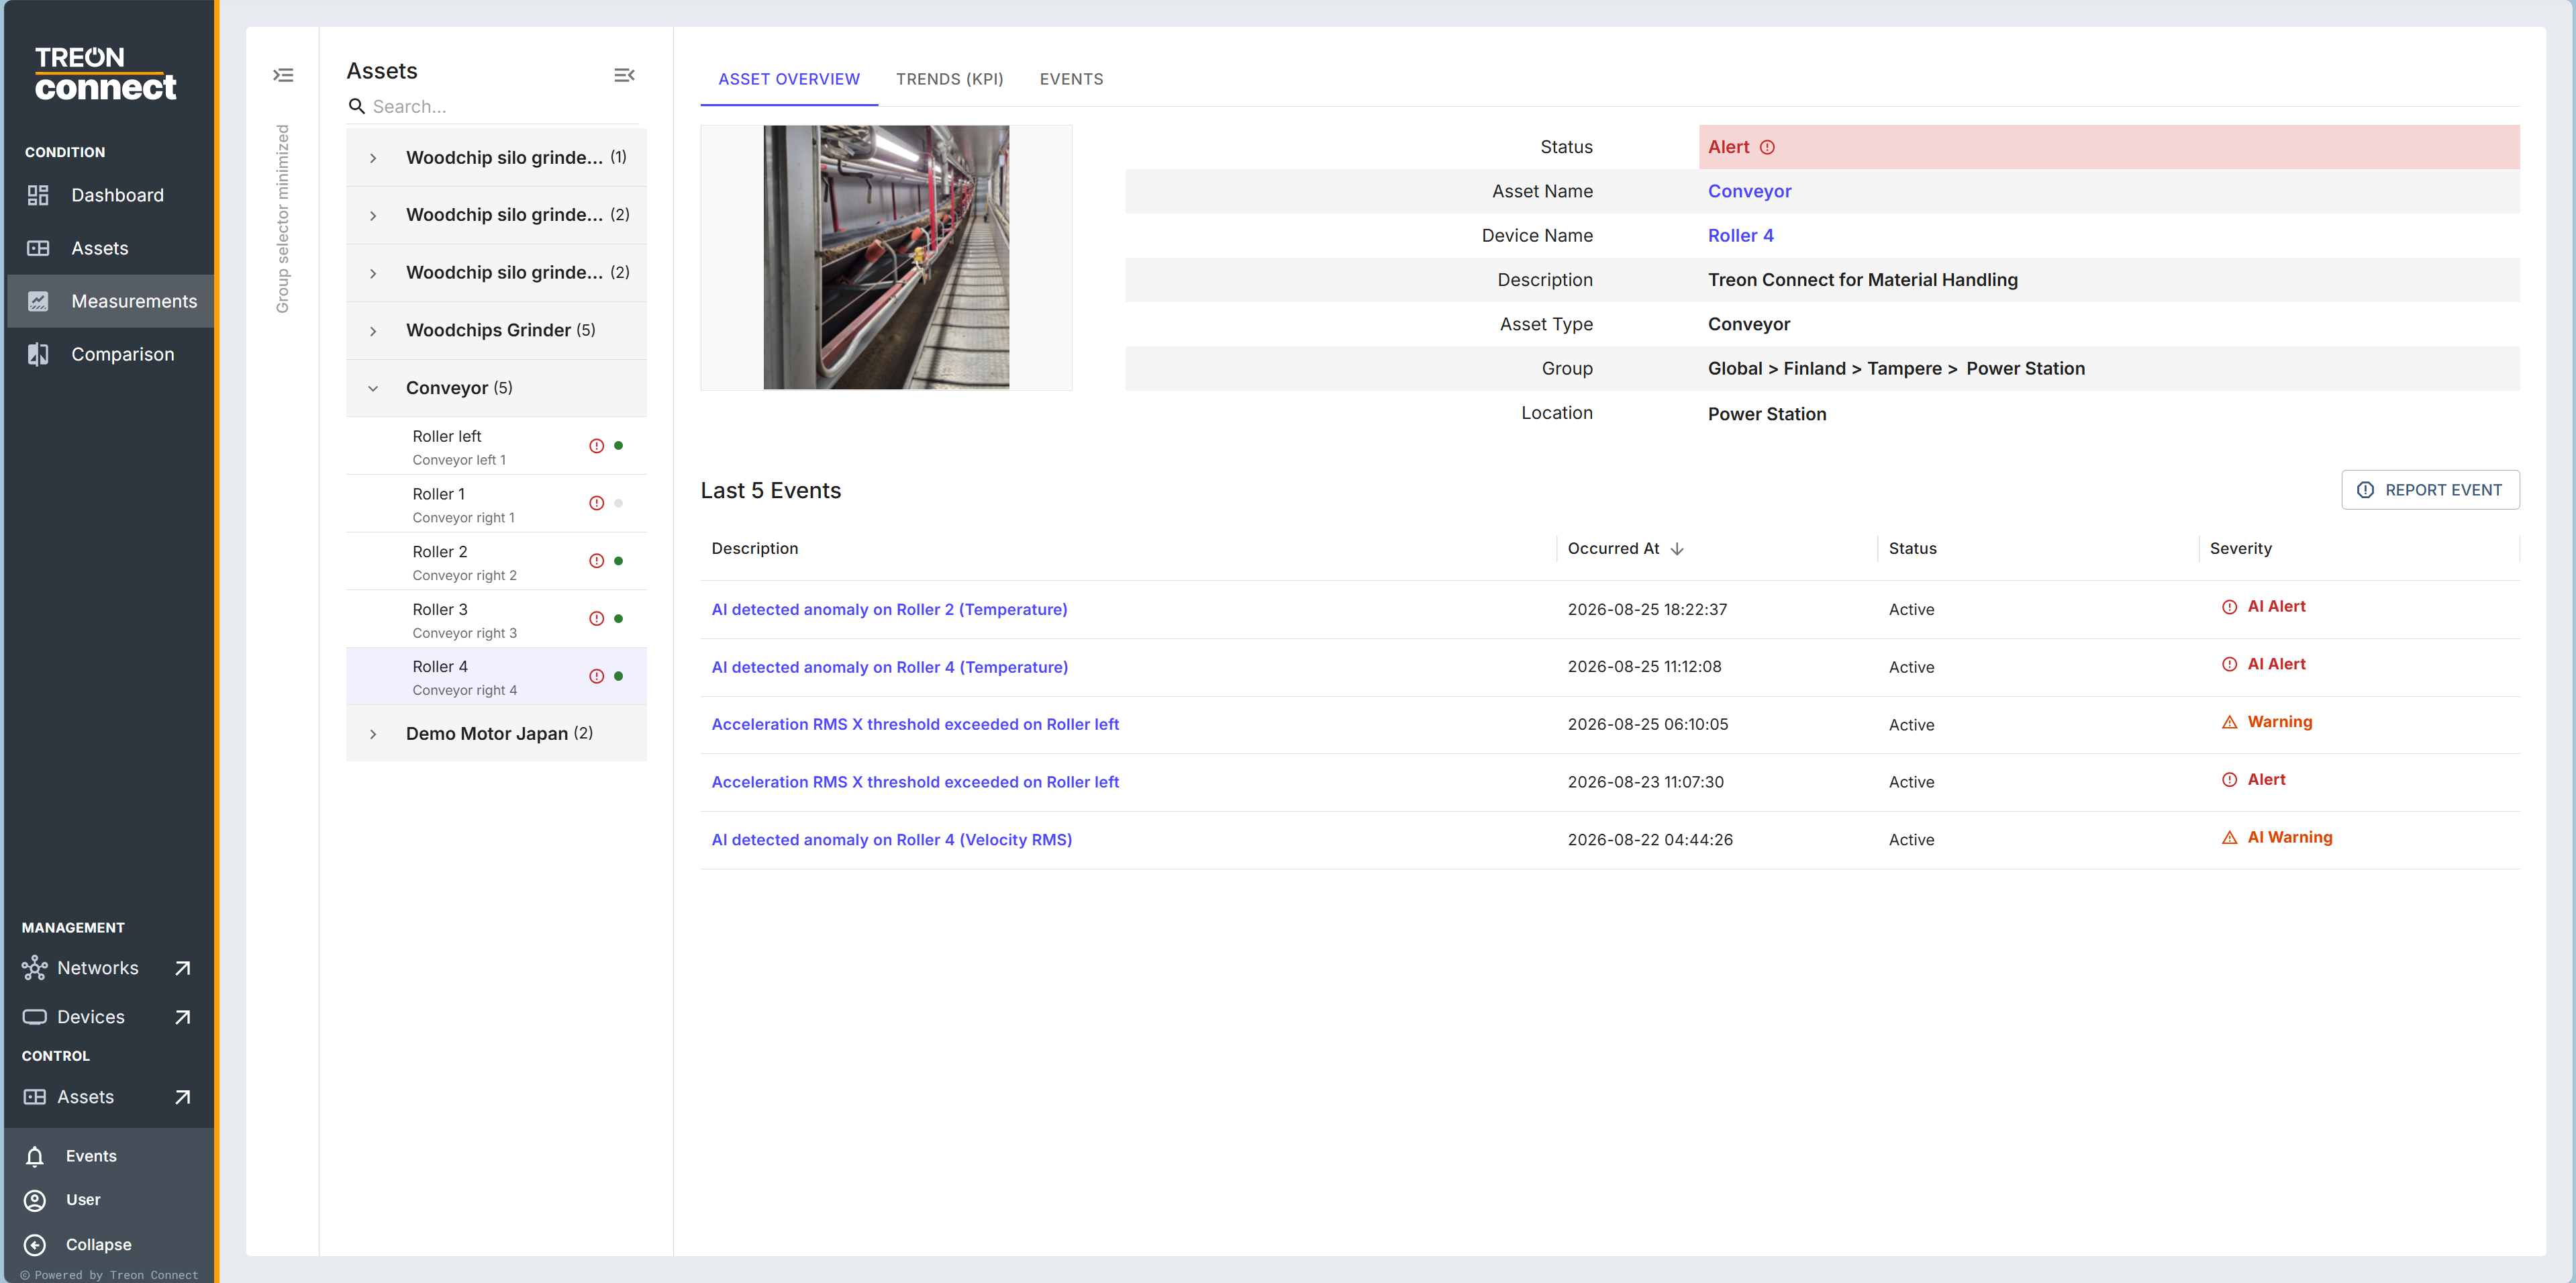
Trends
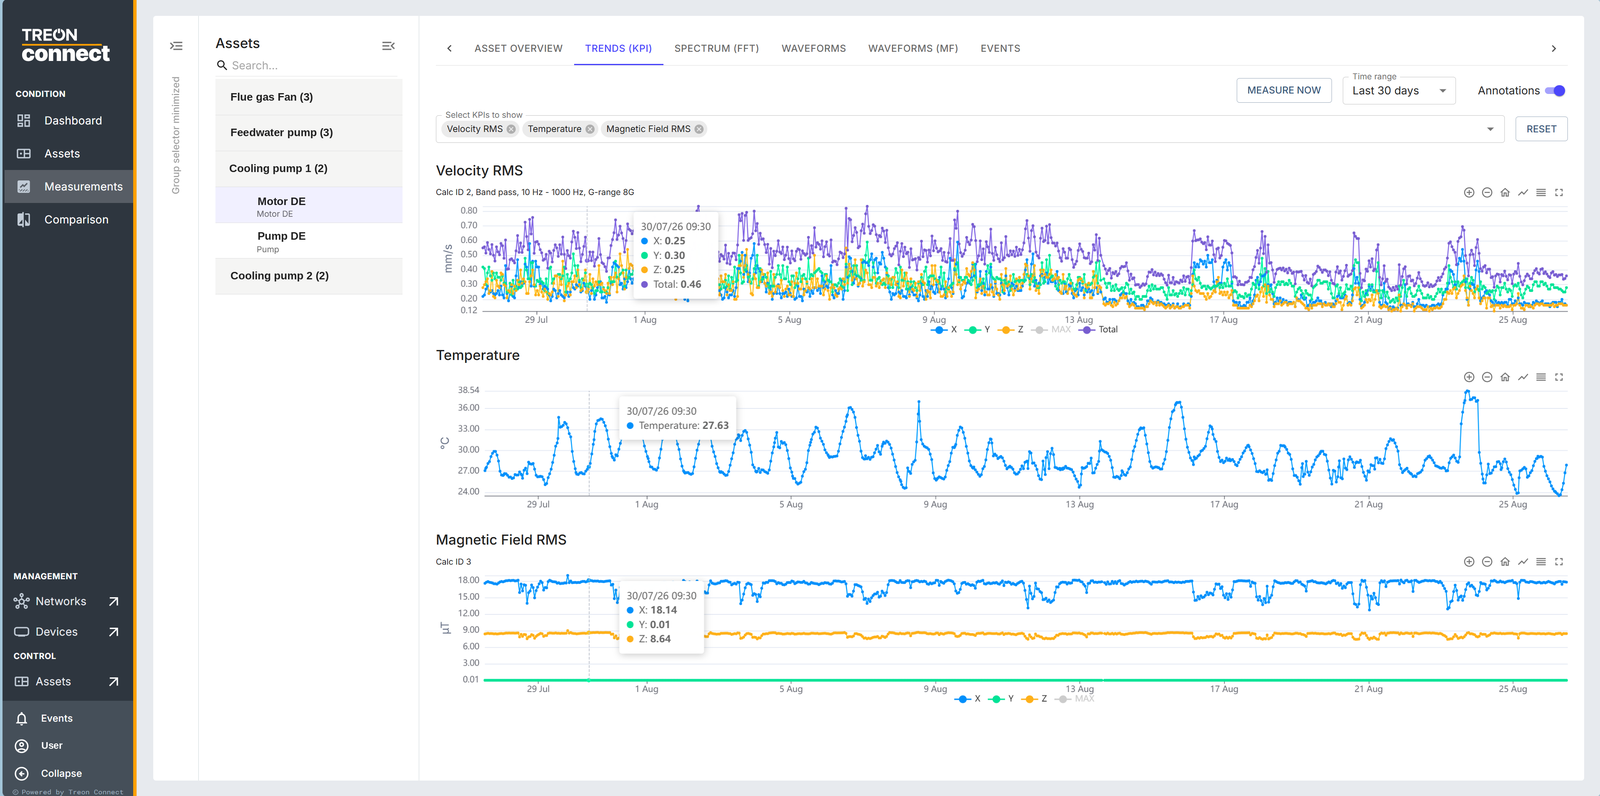
Each KPI is plotted over time. The controls on the trend:
- Select KPIs to show — choose which KPIs are drawn (velocity RMS, acceleration RMS, temperature, kurtosis, and so on).
- Time range — presets Last 3h / 6h / 12h / 24h / 7d / 30d, present day / week / month, or Custom with your own start and end. Reset returns to the default.
- Annotations — toggles markers for configuration changes that affect how a KPI is produced (a calculation-ID or g-range change). These warn you that segments either side of a change "may not be comparable" — so you can tell a real change in the machine from a change in how it was measured.
- ISO / class limits — when the asset has an ISO or custom class, its Warning and Alert thresholds are drawn on the velocity-RMS trend, so you can see how close a machine is to a limit.
- AI alerts are overlaid on the trend, marking where AI anomaly detection flagged a deviation.
Hover to read a value, drag to zoom (and reset zoom), and export the plotted data as CSV (timestamp, max, total). An empty point shows No Trends Data.
Spectrum (FFT)
For a Treon Industrial Node X point, the Spectrum tab shows the FFT of a measurement — the diagnostic view for pinning down a fault frequency. Pick the measurement by time range / date / timestamp (each band plots its axes together). A movable cursor reads off peaks:
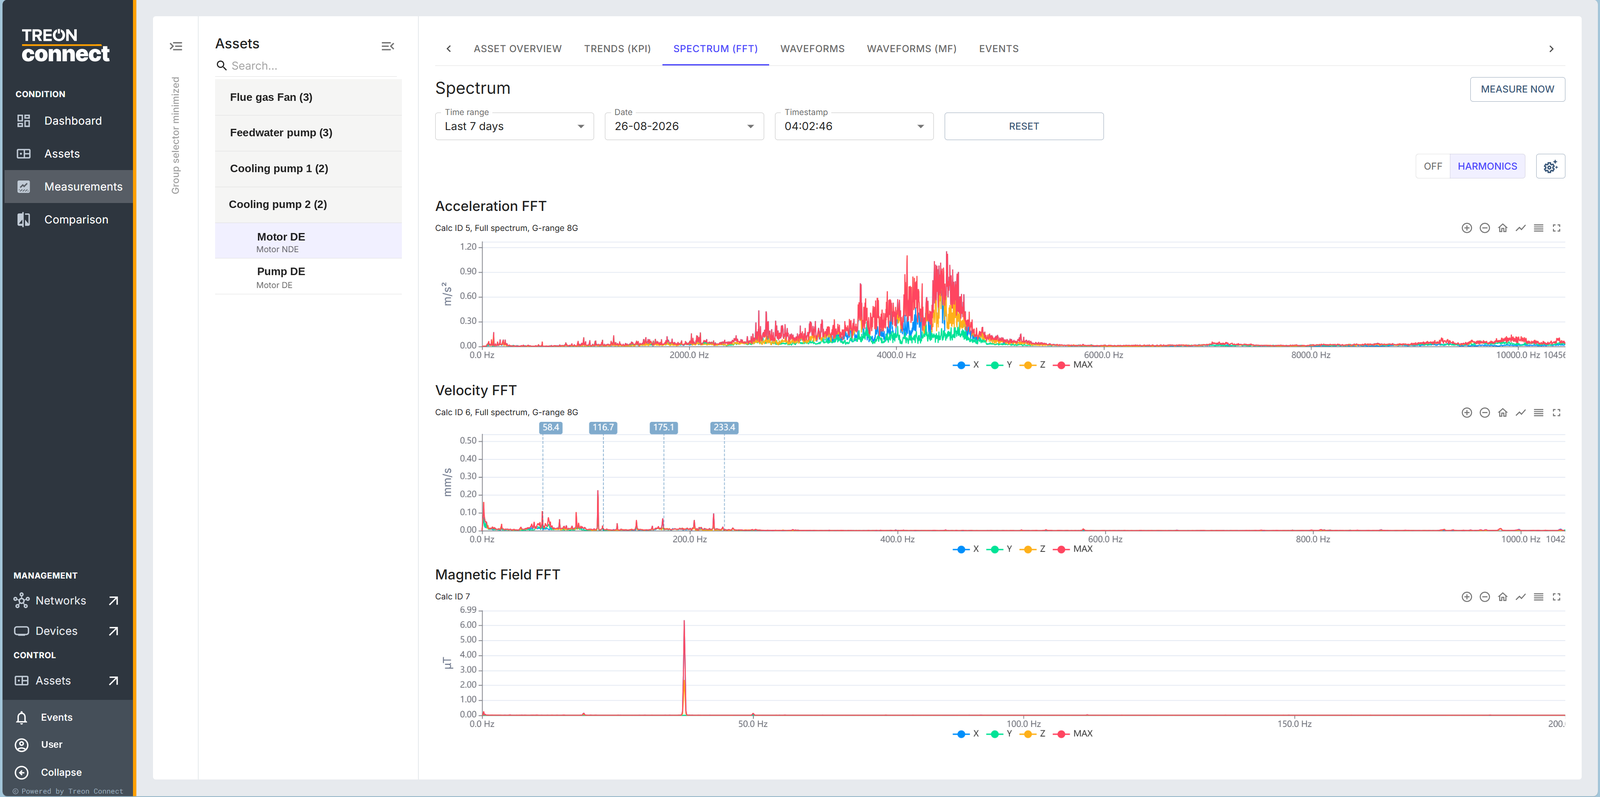
- Off / Single / Harmonics — no cursor, a single-frequency cursor, or a harmonic cursor that marks a fundamental and its multiples.
- Cursor Settings — Snap to Peak locks the cursor to the nearest peak, and you can set the number of harmonics shown.
An empty point shows No Spectrum Data.
Waveforms and Waveforms (MF)
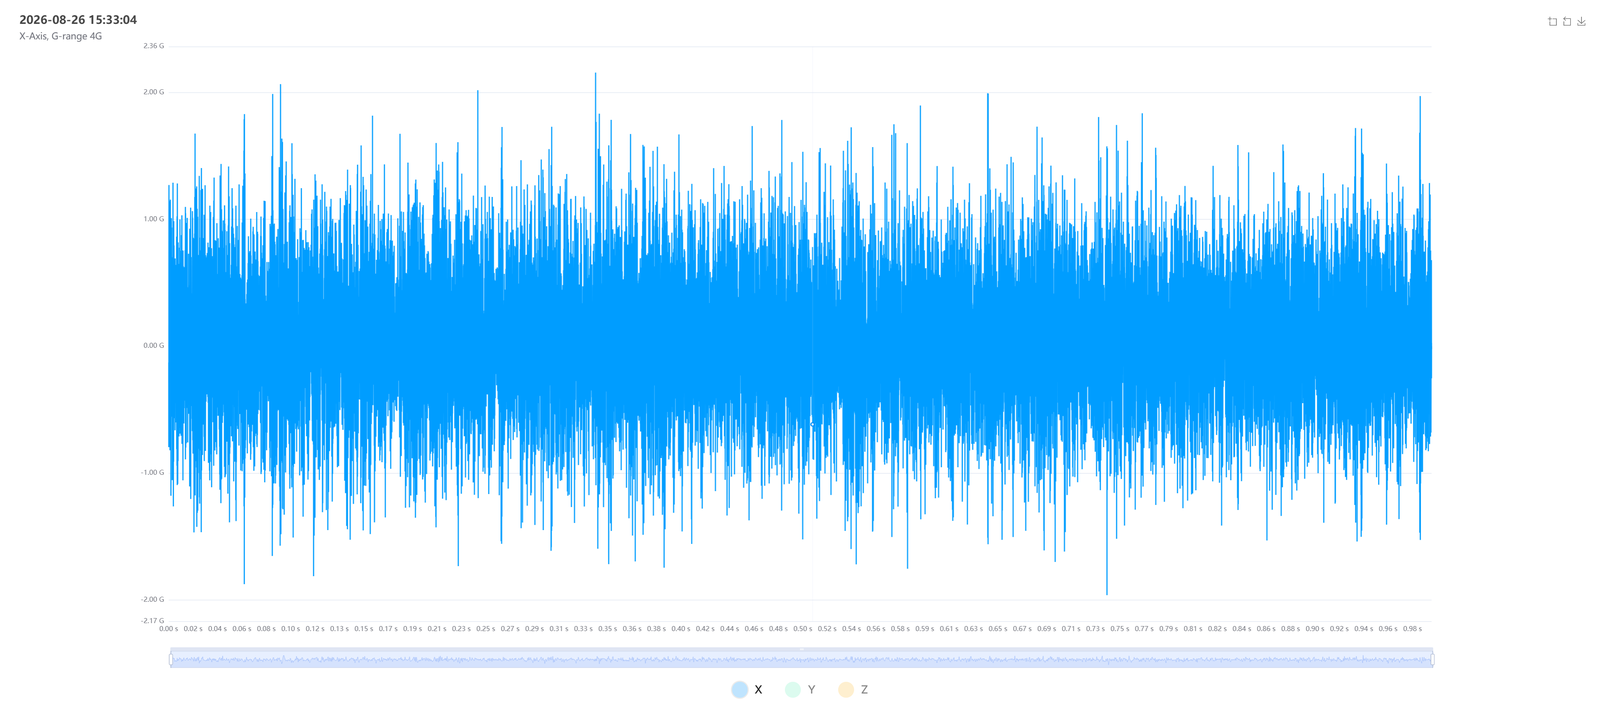
Treon Industrial Node X waveforms live on two tabs: Waveforms for the acceleration signal and Waveforms (MF) for the magnetic-field signal. Each lists captured time-domain signals in a table — Timestamp, Axis, Measurement ID, and a Download. Open one to see its graph, download it as CSV (acceleration in G on the Waveforms tab, magnetic field in µT on Waveforms (MF), each against time in µs), or delete it. If there are none yet, the tab prompts you to trigger a measurement.
Measure now
Rather than wait for the next scheduled measurement, you can trigger one on demand: choose the measurement IDs to capture and Measure. This is how you get a fresh spectrum or waveform while you're looking at a machine (Treon Industrial Node X). The device has to wake and respond, so the result appears a short while later — follow it in Operational Telemetry.
Report an event
If you spot something the automatic rules didn't flag, Report Event raises one manually: pick the related KPI and severity (Warning or Alert) and add a description. The machine then shows as non-healthy and the event is handled like any other in Events.
Setting limits and AI from here
The thresholds, class and AI model behind these events are set per point in Setting event rules.