Comparison
Spot which machine in a line is drifting, or check whether a repair worked. Comparison plots several measurements on one chart, in two modes.
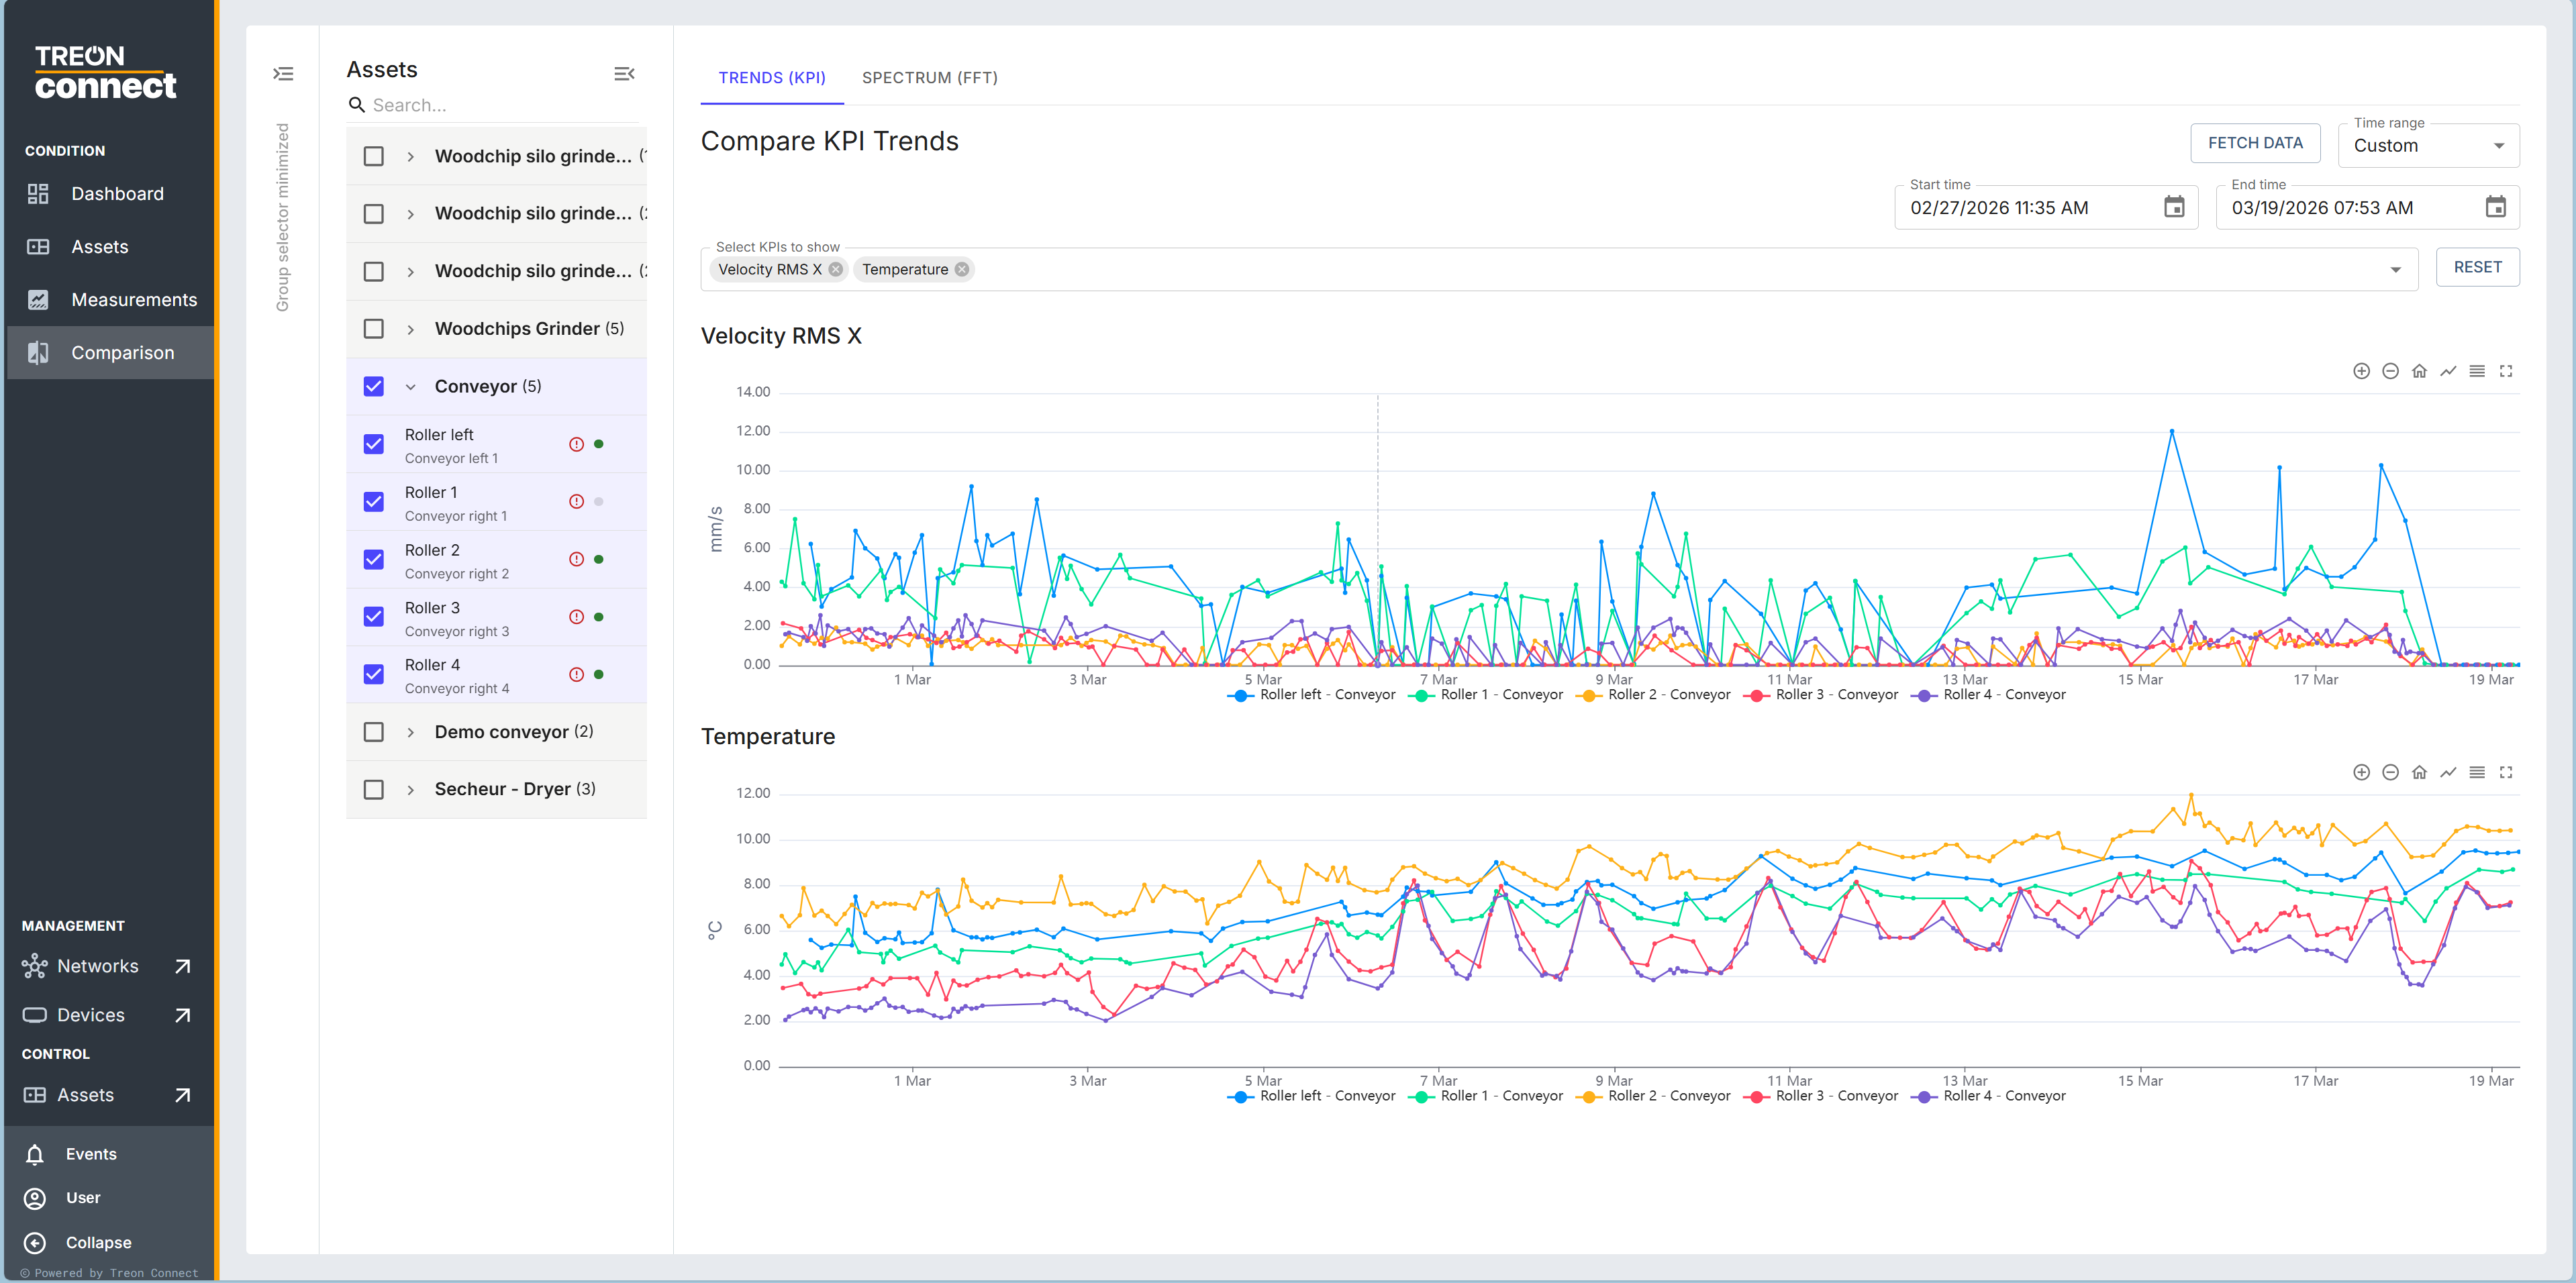
Compare KPI trends
Select several measurement points, choose the KPIs to plot, set a time range, and Fetch data to draw them together. Use it for questions like "are all four rollers behaving the same?" — a single drifting line stands out immediately. You can reset the zoom and export the compared data as CSV.
Compare spectra (waterfall)
For a single Treon Industrial Node X point, you can line up several spectra — add them by axis, type and filter across different dates — overlaid on one chart to see how the frequency content changed over time. This answers "is this bearing worse than it was last month?": a peak that grows across successive spectra is a fault developing. View fullscreen and export as CSV.
Spectra comparison needs the FFT data that only Treon Industrial Node X captures; Treon Industrial Node C points compare on KPI trends only (see platform and solutions).