Connectivity verification
An installation is not finished when the hardware is mounted — it is finished when every sensor's data is arriving in Treon Connect. This guide is the check, and it is worth doing twice: once on the bench before you travel, and once on site afterwards.
1. Dry-run before deployment
Testing off site is far easier than testing in a plant, and it rules out whole classes of problem before you are standing on a ladder.
You need: all sensors and gateways powered on, the gateways connected to the network (allow 5 minutes for Ethernet and Wi-Fi, 10 minutes for cellular), and access to your Treon Connect instance.
You are looking for: every sensor reporting connected, sensor data arriving in Treon Connect, and no errors.
2. Check each sensor at the machine
On a Treon Industrial Node X, press and hold the power button until the status light turns green, then release. The light goes out for a moment and then shows the connection status:
| Light | Meaning |
|---|---|
| Green | Connected to a gateway. |
| Red | Not connected. |
| No light at all | Not powered on, or the battery is exhausted. |
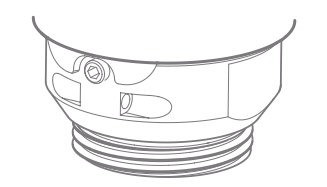
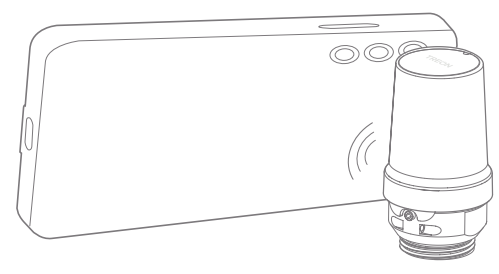
A red light on a node that has had time to join, with a powered gateway on the same network, means the radio path is the problem: the node is too far from the gateway, or something is blocking it. Move the gateway closer, or add a routing node between the two.
The top cap has to be off to see the light or press the button.
3. Confirm the network map
Open Networks. The map shows gateways, sensors and the links between them. Every sensor you installed should be on it.
If one is missing, it has not joined: check power and activation, then range to a gateway or a neighbouring node, then Refresh. A whole missing branch is usually one ungrouped hop — see a sensor isn't on the map.
4. Read the link quality
Use the map and Diagnostics to check signal strength. Wirepas recommends staying at −75 dBm or better:
| RSSI | What to expect |
|---|---|
| ≥ −60 dBm | Excellent. |
| −75 to −60 dBm | Good — target this or better for stability. |
| −80 to −75 dBm | Average. KPIs fine; FFT and raw data may struggle on larger networks. |
| −85 to −80 dBm | Bad. KPIs work; FFT and raw data will drop packets. |
| ≤ −85 dBm | No usable connection. |
In an open setting, node-to-node and node-to-gateway distances of 10–60 m are realistic. Radio behaviour in a plant is hard to predict: a distant node can be strong because a surface reflects just right, and a close one weak because a small obstacle sits in the wrong place. Also account for how the space is used when fully operational — people, forklifts and moving goods all affect the signal.
5. Stress-test before you leave
Do not wait for the scheduled measurement intervals. Trigger a measurement on every sensor with Measure Now so the whole mesh carries data at once, and check that nothing is lost or late.
This matters most if you rely on FFT or raw waveform data, which is sent as hundreds or thousands of fragments rather than a handful of messages. If data goes missing under load, the fix is a better mesh layout — more routing alternatives, an extra gateway, or staggered trigger times — not a change on the sensor. See Network.
Raw data is slow by design
Waveform and FFT data can take up to about 10 minutes to appear after a measurement. Late is not the same as lost.
6. Hand over
Once every device is online and verified, the administrator creates the assets and attaches your devices as measurement points. New devices may also prompt a firmware update.